Web-Based, Full Solution Software Product, For Financial Consolidation, Management and Operational
Analysis, With Embedded Qlikview BI Technology
THE PROBLEM
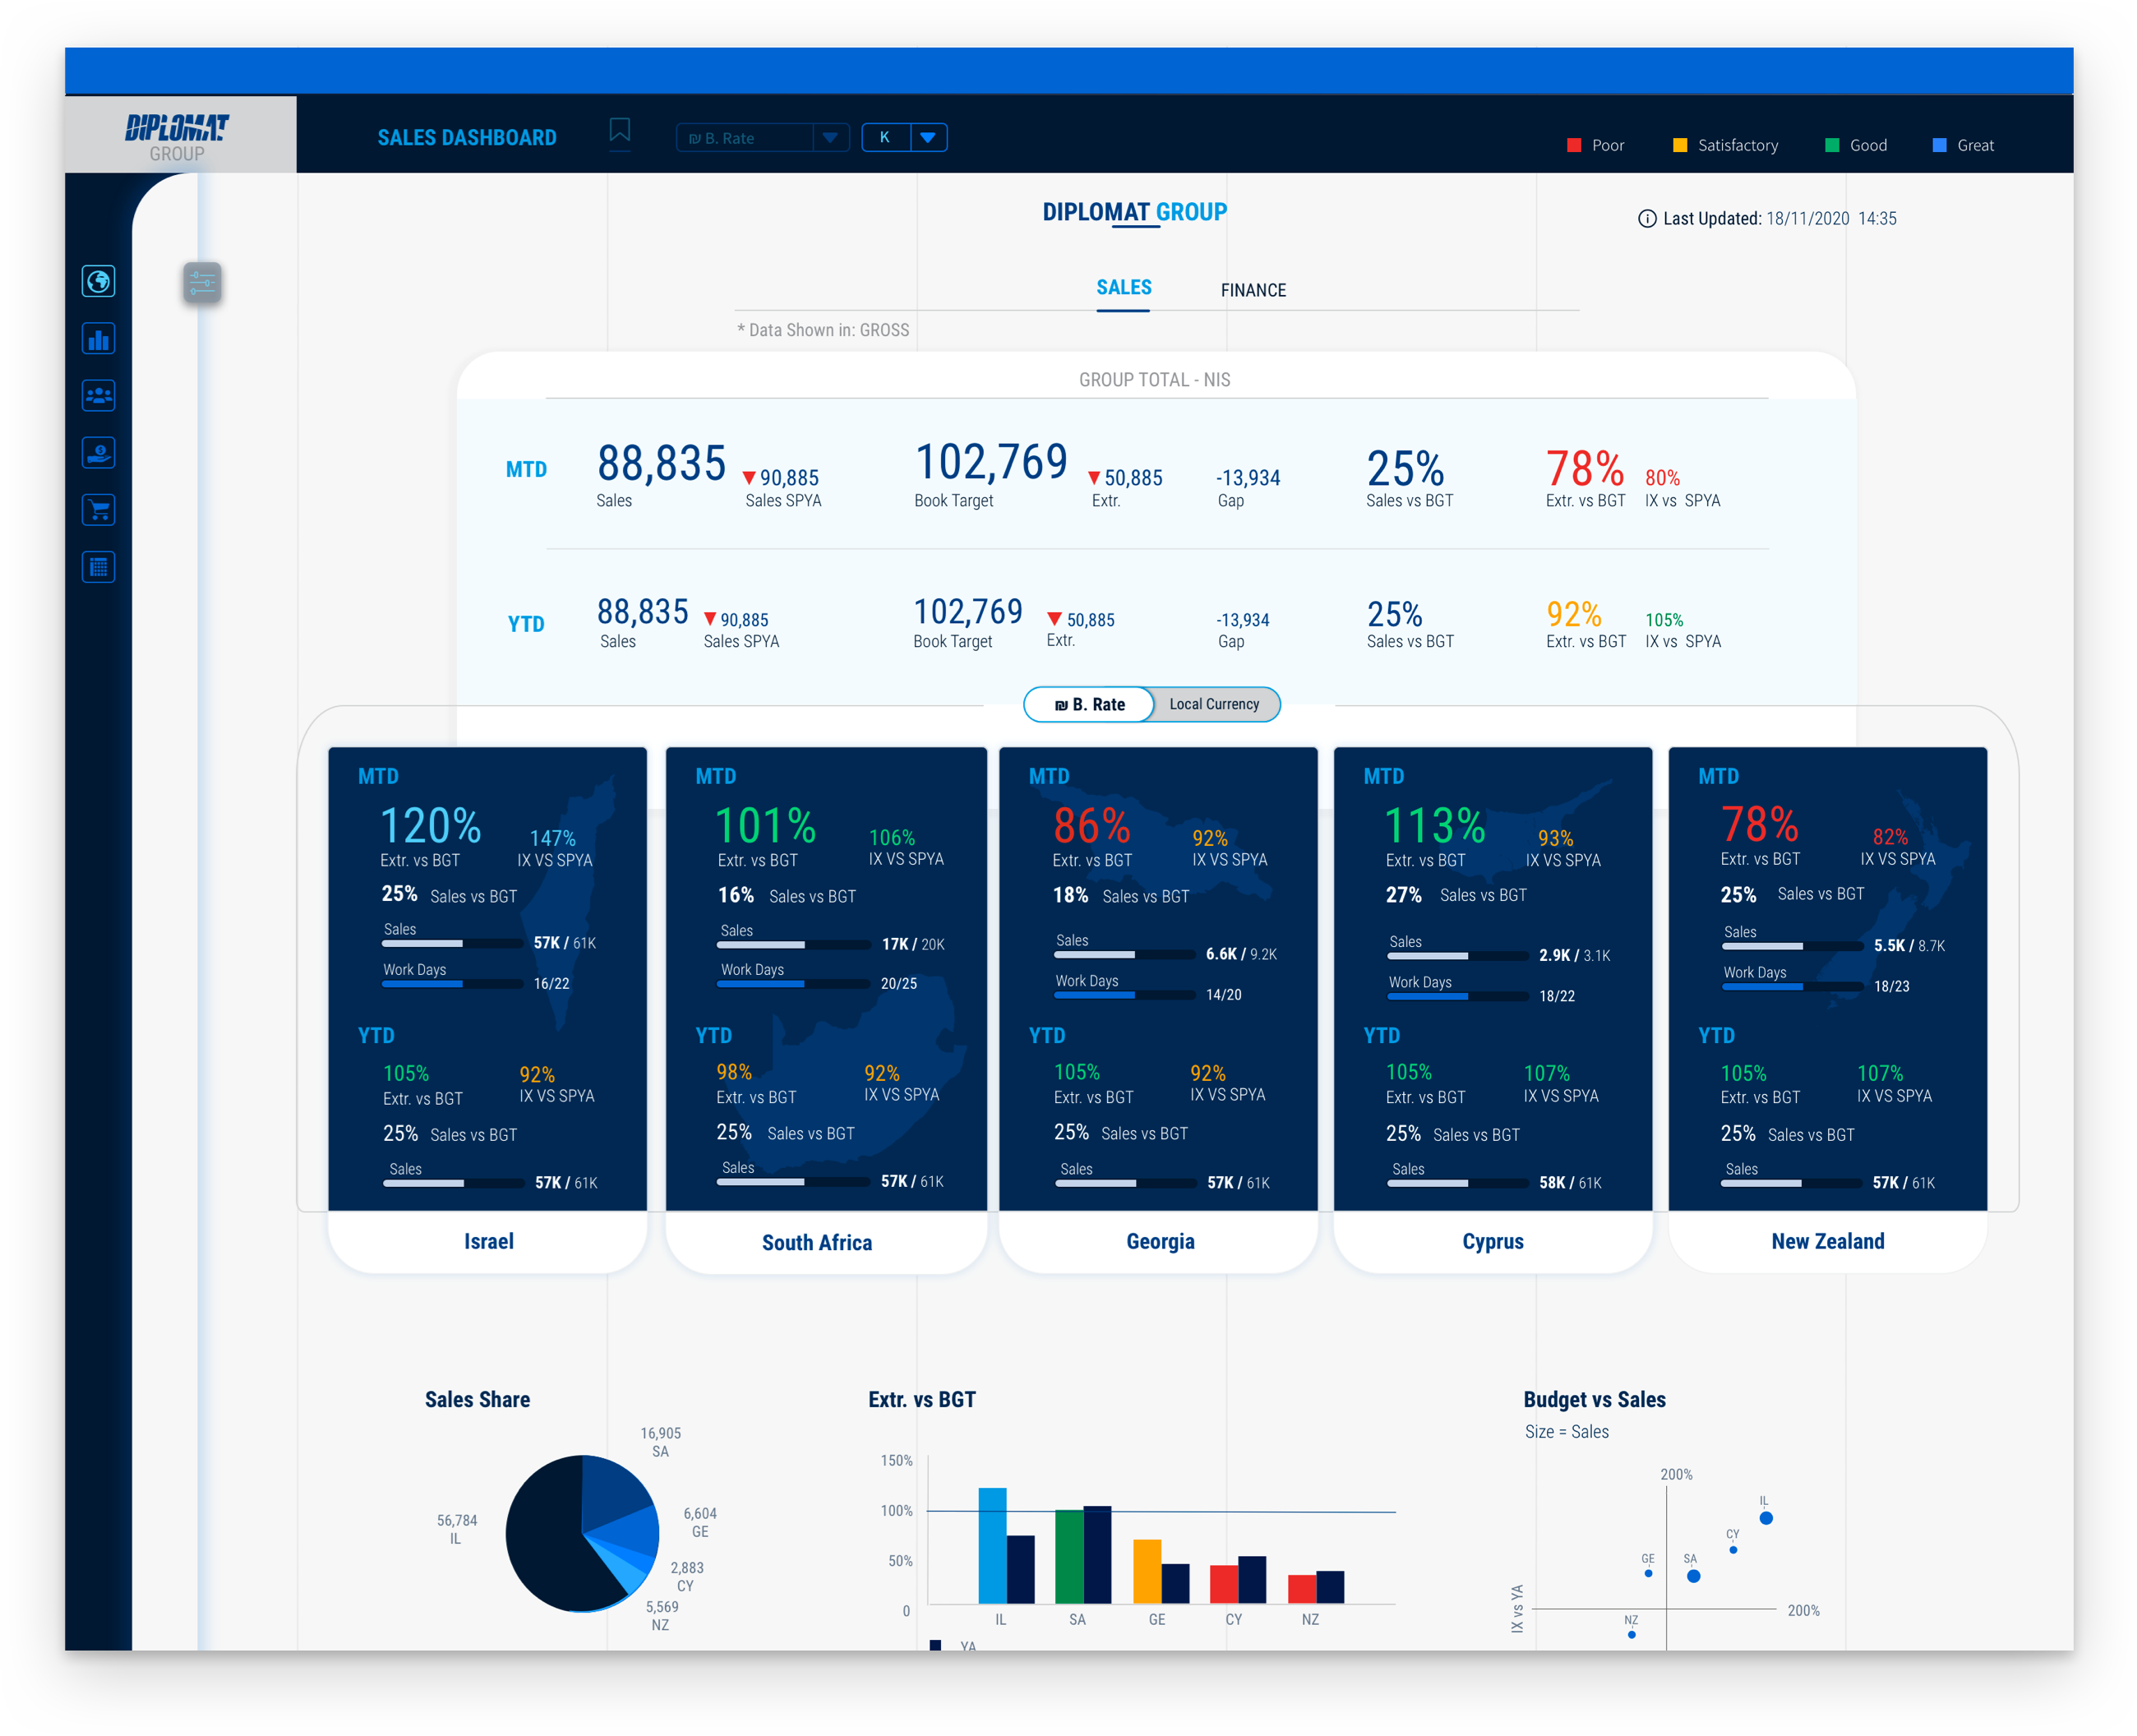
Sales dashboard contains a massive amount of data that changes in real-time addressing a non-analitics user needs to emphasize the abnormal data on each time user enter the system.THE SOLUTION
The dashboard uses colors for the different dimensions as the user knows them from an old interface. the interface designed from macro KPIs through simple charts that contain one dimension and one measure to complex charts that analyzes more than one dimension/ measure and at the bottom a table chart that contains all aggregative data
MY ROLE
Team leader,User Research, User Interviews, Persona Creation, User Journey, Information Architecture, User App Flow.TOOLS
Sketch
-
-
focus on a chart
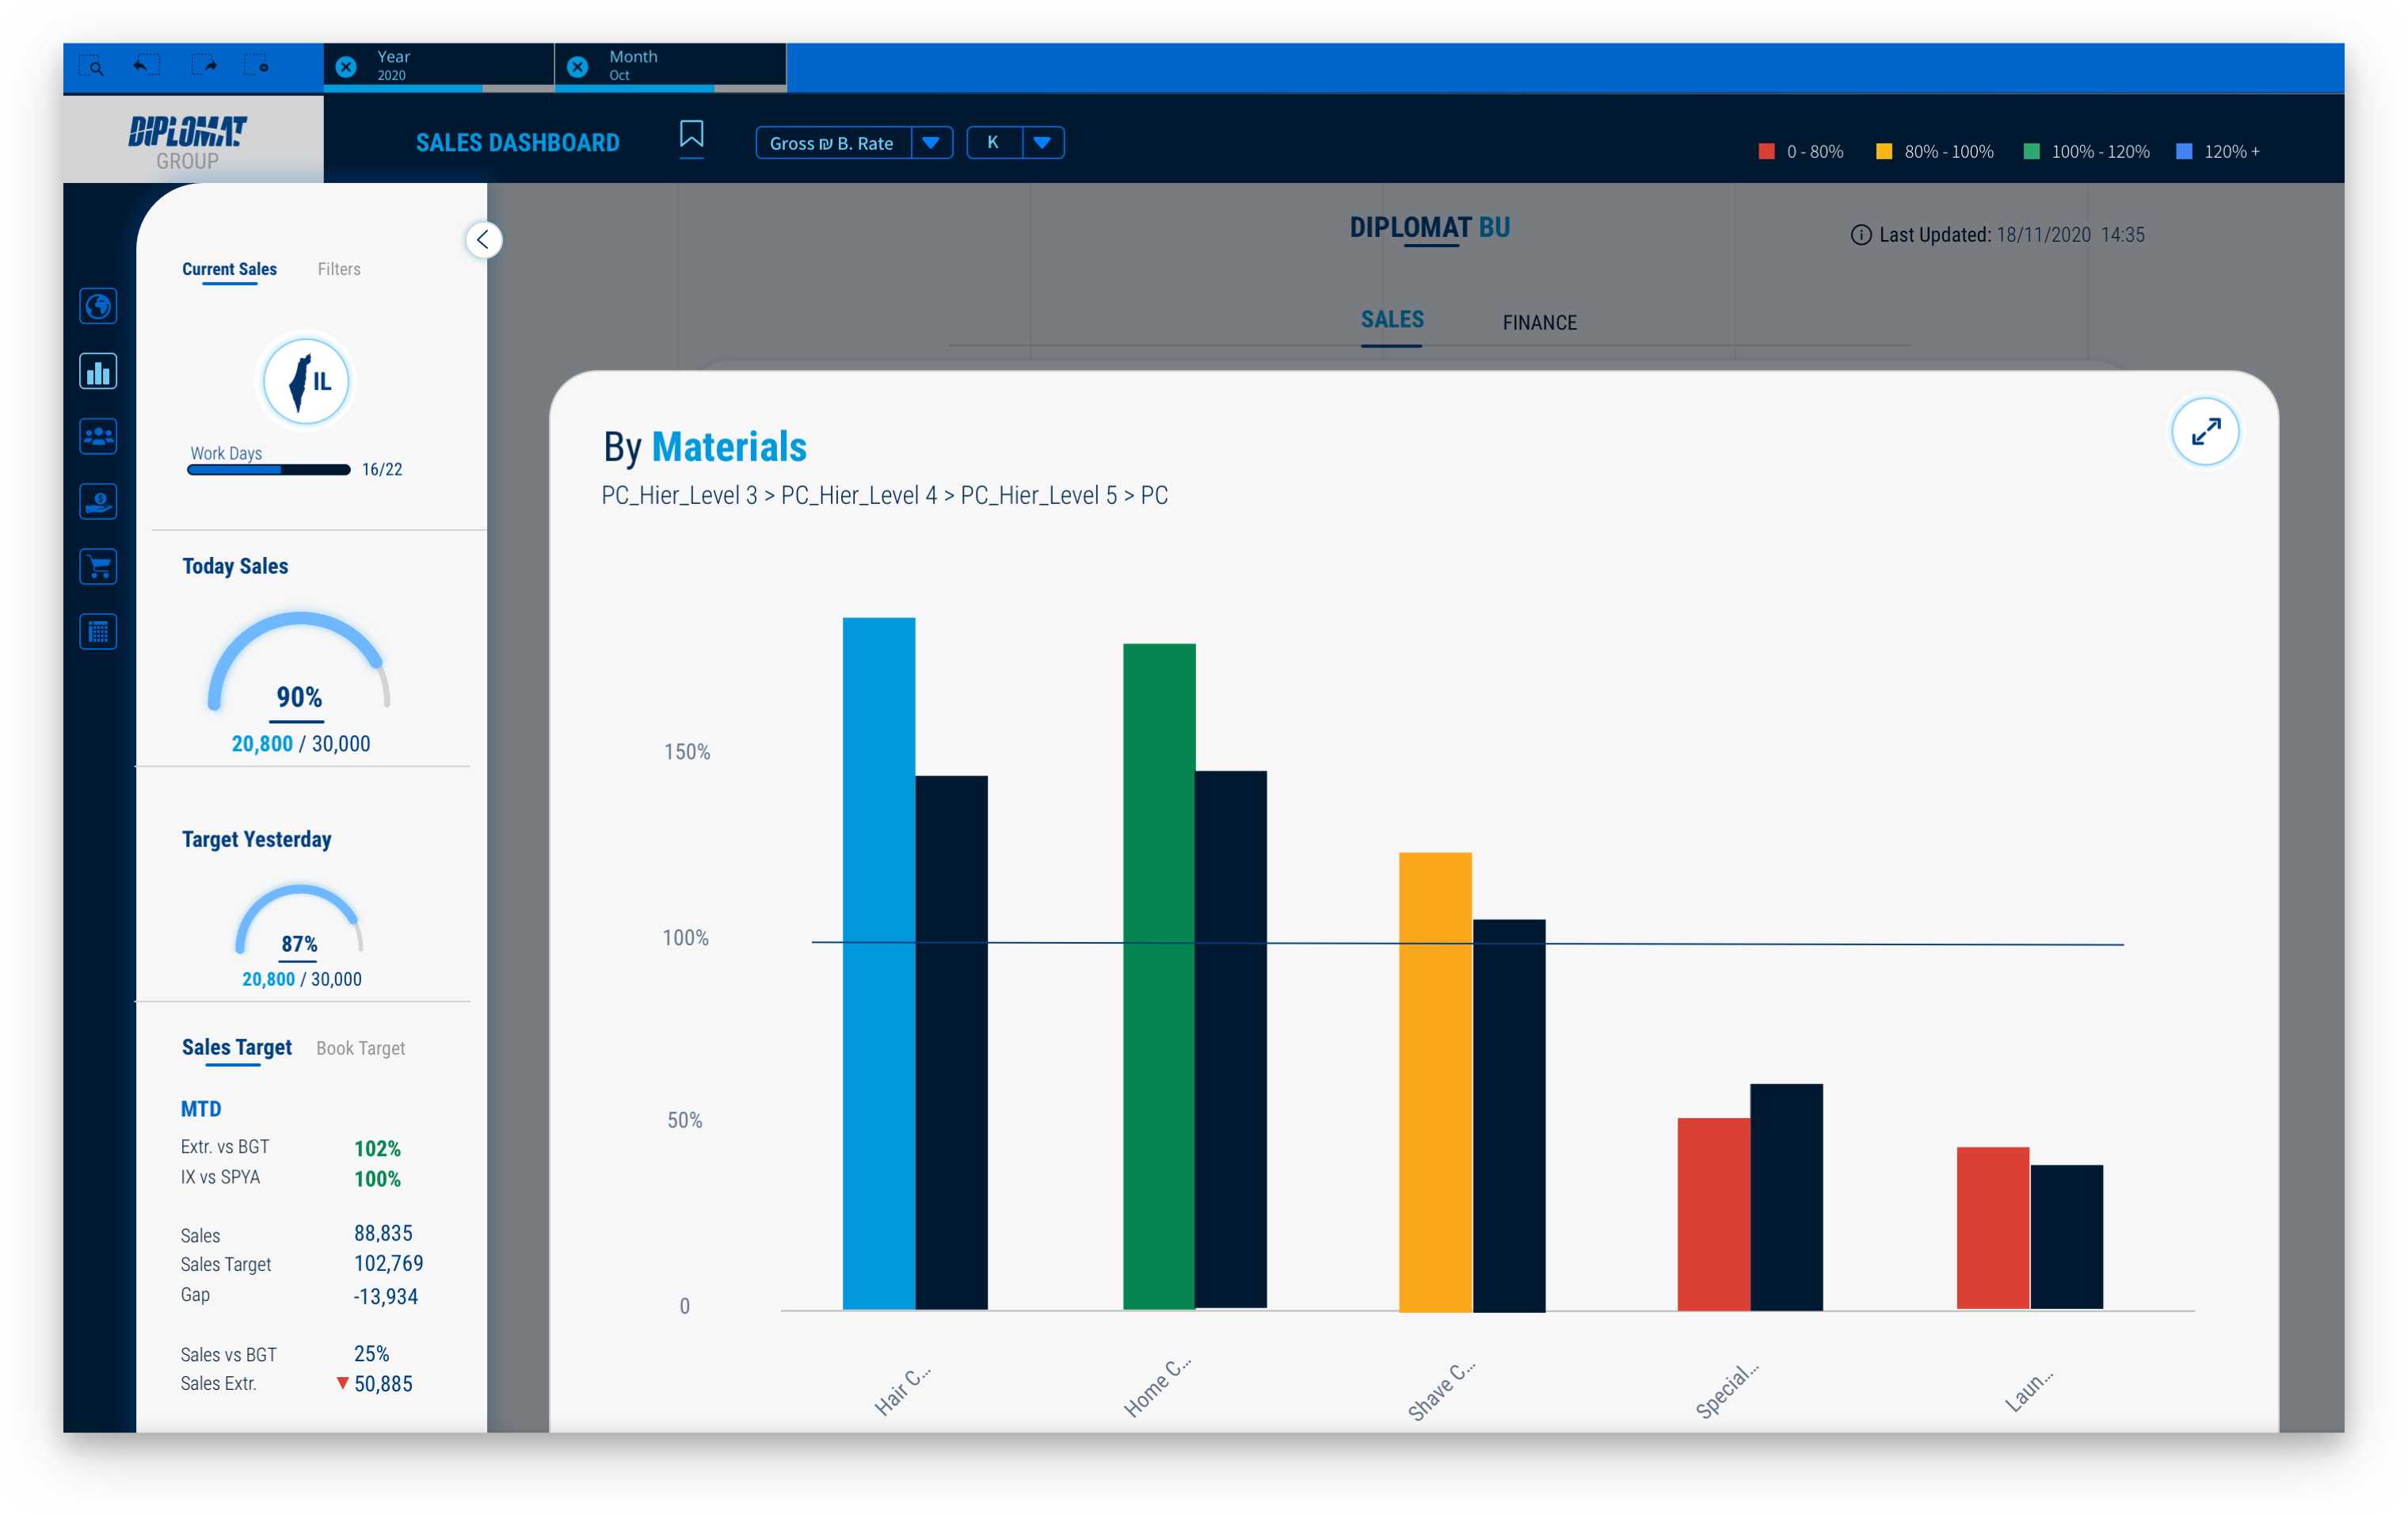
each chart can open in full screen allows the user to focus the relevant analysis
-
Advanced user
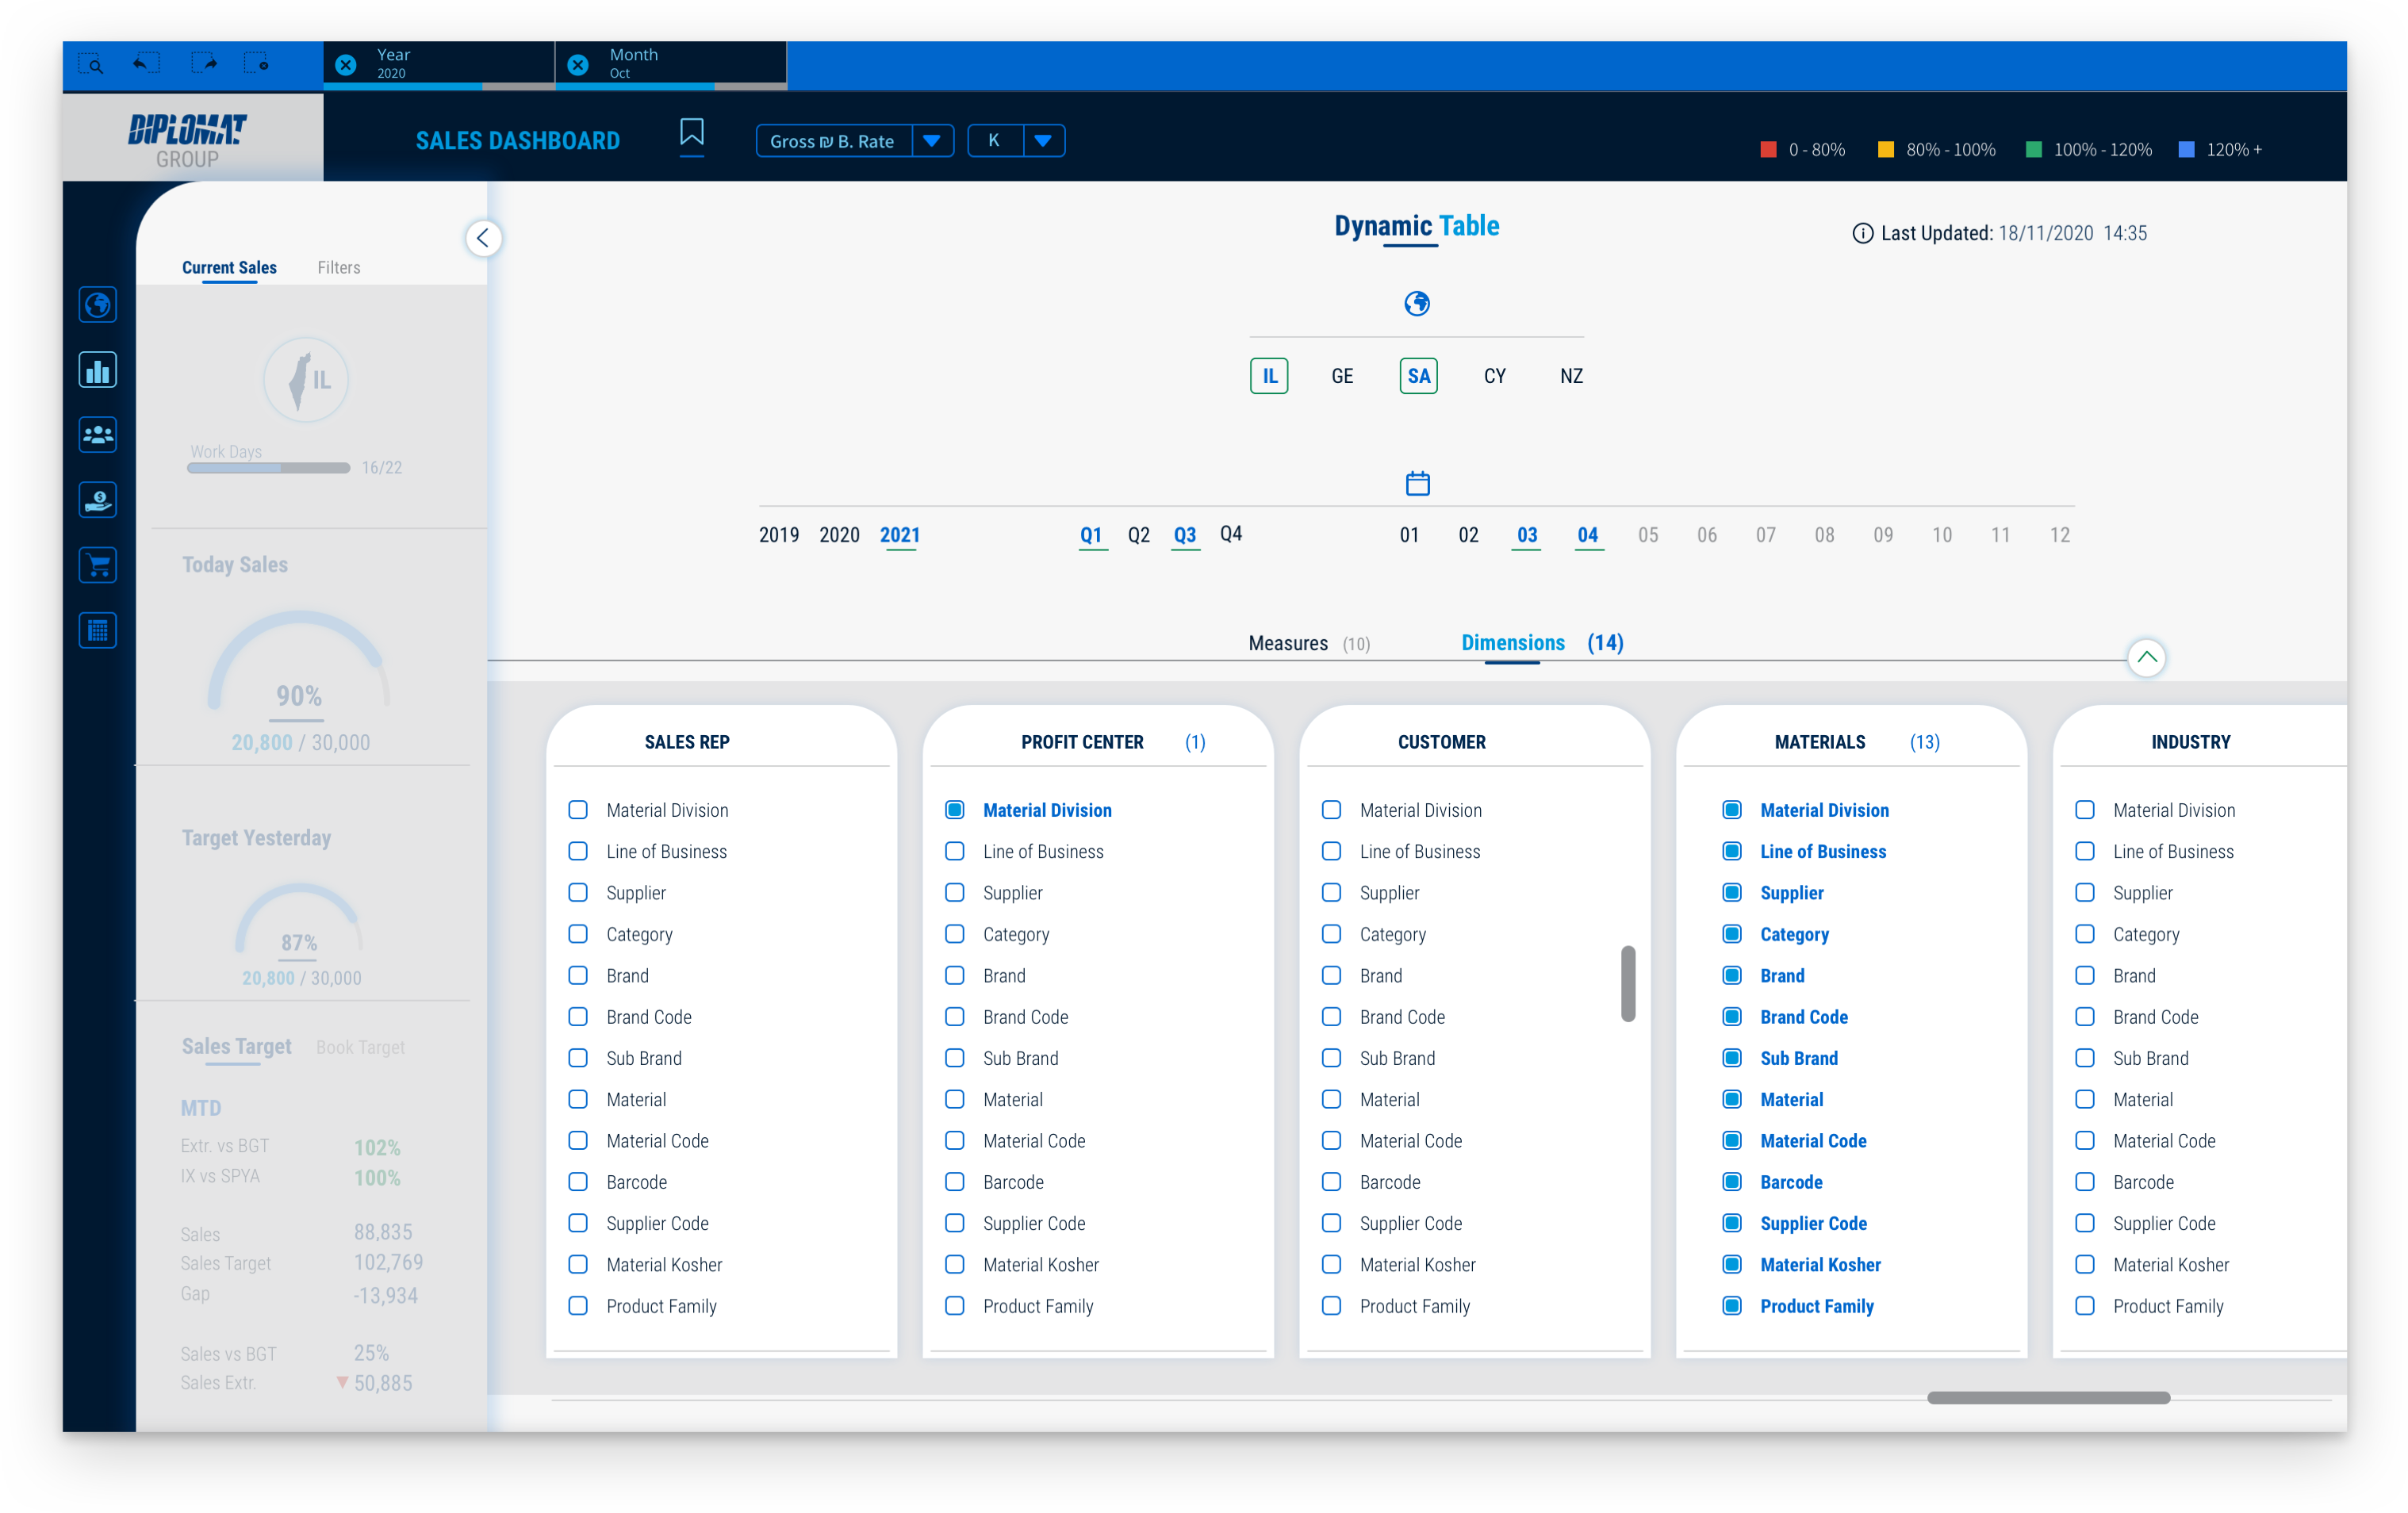
dynamic table chart
for the advanced user, I designed a dynamic table chart that allws him to set his own dimensions and measure to annalize